
Contents
In the last trading session, there is one stock which has given a multi year breakout after 8 years. Do you know this stock?
JM Financial LTD
JM Financial LTD has given a multi year break out after 8 years. The stock looks to be a in a strong path of recovery. The monthly, weekly and daily charts are looking very attractive. Lets discuss about this.
Monthly Chart
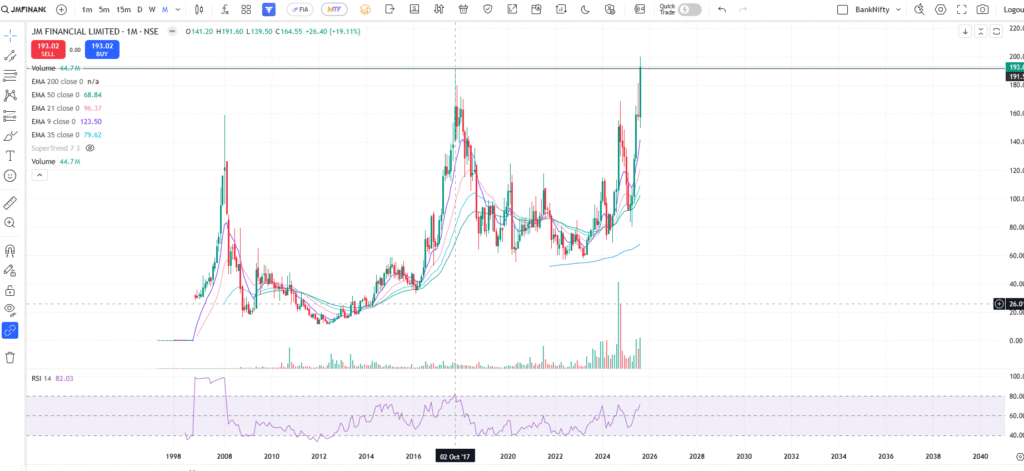
The monthly chart is showing that the last time it made all time was on October 2nd, 2017. In the last trading session, the chart shows that it has already given a break out and now trading just above the 8 year old all time high.
Weekly Chart
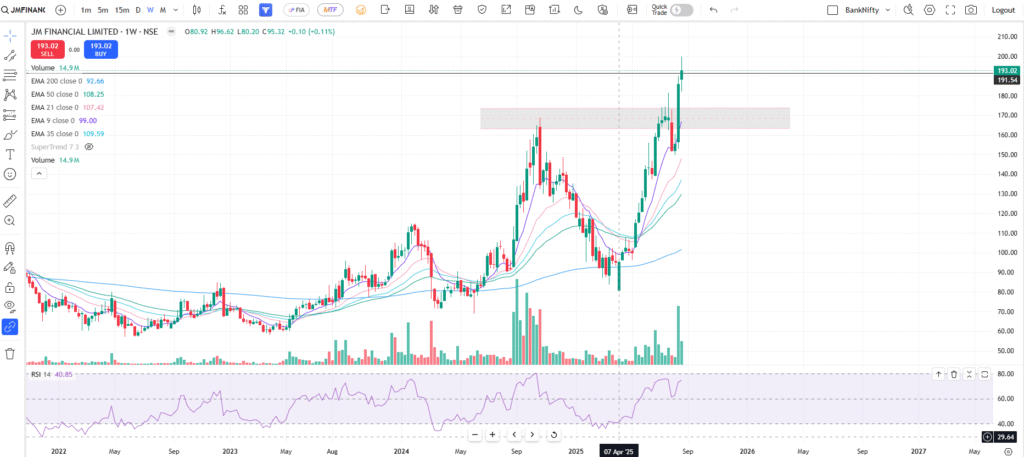
The weekly chart of JM financial LTD also shows a continuous up trend from April, 2025 onwards. There was a small retracement around the level of ₹172 – ₹175 but the price broke this level soon and now trading all time high.
Daily Chart
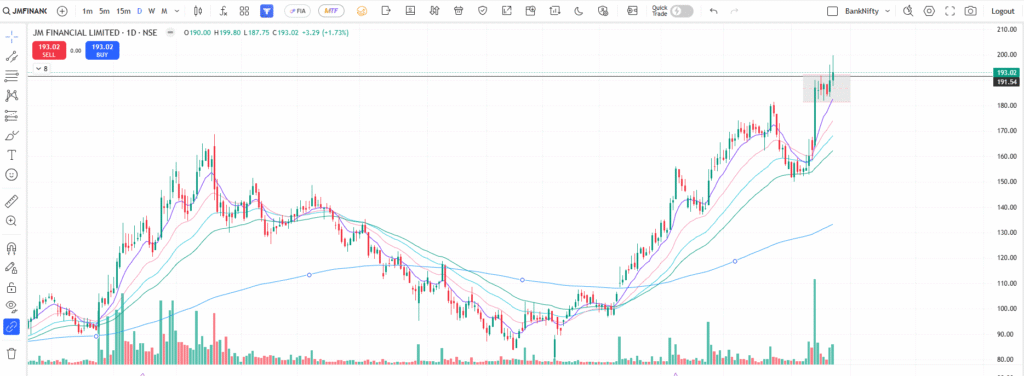
On the daily chart of JM financial LTD in last couple of trading sessions, we can see that the price was consolidating. In the last trading session the price has given the break out.
Point To Be Cautious For Next Week
Even though the chart looks attractive, the last candle is shooting star. This signals that its the area that needs to be evaluated with care. If the price retest the the high of the shooting star and gives a candle breakout, the chart may go up high from this level. We also need to consider the global market uncertainty while taking any decision.
Finance State Of JM Financial LTD
- JM financial LTD is on the target of recovery.
- It has captured the market share of 4.3% in the asset management business.
- It has highest ever operating PAT at ₹454 crore. This is highest ever and a well notable achievement despite of all global tensions and market high volatility.
- It’s net worth has crossed ₹10000 crore for the first time.
- It’s book value is now 106.4 per share that’s impressive!!
- Net revenue growth is 22% on year on year basis.
- Pre-provisioning operating profit is up by 22% YoY.
- There net revenue growth is up around 22%.
- JM financial LTD has reported the net reversal of impairment at ₹204 crore added by significant recovery in the real state lending and ARC business.
- The borrowing are reduced by ₹4300 crore over the last 12 months while maintaining the strong profitability.
Click here to see the Q1 Financial Year 2026 Results.
Disclaimer – This is not an investment advice. It is for educational and informational purposes only. Stock discussed in this article is used for an example. Please read our disclaimer for more.